Worldwide Airfield Summary
The
Worldwide Airfield Summary
provides
climatological data for airfields and geographical areas
throughout the world. There are 10 volumes, some
published in two or more parts.
CLIMATOLOGICAL REFERENCES
There are many references, which can be used in
climatological work, so many in fact that they would be
too numerous to list here. They are tabularized in the
following publications:
Guide to Standard Weather Summaries
(NAVAIR 50-1C-534) contains an index of all the
standard
machine-tabulated
summaries
available
through FNMOD, Asheville.
In addition, many navy climatic references are
listed in the Navy Stock List of Forms and Publications,
NAVSUP
publication
2002,
section
2B.
Navy
climatology
publications
are
found
under
the
NA-SO-1C-series.
The following publications can also be used to
prepare climatological briefings and packets:
U.S. Navy Marine Climatic Atlas of the World,
volumes 1 through 7 and 9 (NAVAIR 50-1C-528
through 533, 550, 554, s and 565). These
publications contain climatic data for all the
principal ocean areas of the world. They have
both land and ocean sections. The surface
section contains data presented by graphs,
tables, and isopleths on such elements as surface
winds, visibility, precipitation, storm tracks, etc.
The oceanographic section includes charts of
tidal data, currents, and ice.
U.S. Navy Hindcast Spectral Ocean Wave Model
Atlases, volume 1, North Atlantic (NAVAIR
50-1C-538),
volume
2,
Pacific
(NAVAIR
50-1C-539). These atlases represent ocean wave
data by tables, bar graphs, and isopleths. Data is
based on numerically derived historical data in
the form of wind and wave climatology. These
publications are designed to provide a more
accurate representation of overall ocean wave
climatic data for some applications. They are
designed to supplement but not supersede the
conventional Marine climatic atlases.
Local Area Forecaster’s Handbooks
The Local Area Forecaster’s Handbooks, as
required by NAVMETOCCOM Instruction 3140.2( ),
contain valuable information on local and area weather
as follows: A description of the local topography,
terrain and general synoptic characteristics of weather
occurrences in the
area. Mean storm tracks for the
region, a limited amount of climatological data, and
local forecasting rules and techniques are also
available. A handbook can serve as a composite
summary of expected weather events and the effects of
certain parameters on local weather.
6-15
0
1
2
3
4
5
6
7
8
100
90
80
70
60
50
%
40
30
20
10
0
NE
N
E SE
S SW W NW C
0
*
1234
}
}
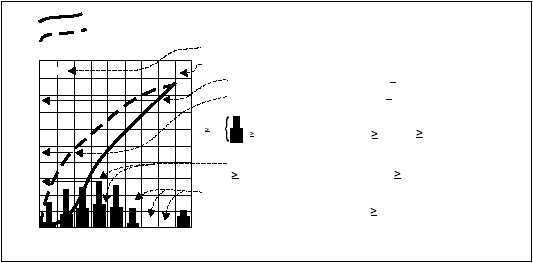
Total Cloud Amount
Low Cloud Amount
CLOUD AMOUNT IN EIGHTHS
Cumulative percent frequency of indicated cloud amount equal to or
less than the amount intersected by the curve.
Number of observations.
Obscurations
(77% of all total cloud amounts were
7/8.)
<
<
(46% of all low cloud amounts were
2/8.)
Low cloud amount: Percent frequency of observations
from each direction and calm that were accompanied
by low cloud amounts
5/8 and
7/8. Low clouds
are clouds with bases <8000 feet.
}
}
5/8
5/86/8
7/8
&
(28% of all SE winds were accompanied by low cloud amounts
5/8 and 14% by low cloud amounts
7/8.)
An asterisk indicates that the percentage is based on 10 - 30 obser-
vations of wind direction, total and low cloud amount. 0 replaces
bar graph when no low cloud amounts
5/8 were observed with
a wind direction or calm. 0 or bar is omitted when number of
observations of total and low cloud amount from a wind direction
or calm is less than 10.
AG5f 0606
Figure 6-6.—Combination bar and line graph (with legend and instructions for use).


