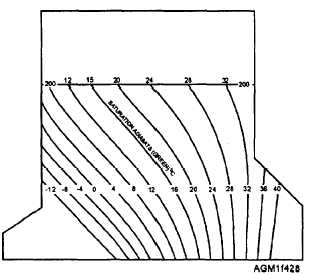
curved green lines (fig. 4-28) at a 2°C interval. Each
saturation adiabat is labeled with the Celsius
temperature value of its point of intersection with the
1,000-hPa isobar, and is also indicated by the green
numbers at the 200-h.Pa level where the scale ends.
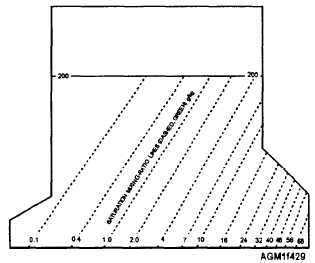
Mixing Ratio Lines
The saturation mixing ratio is the greatest amount
of water vapor that may be contained in a parcel of air,
expressed in units of grams of water vapor kilogram of
dry air (g/kg). Dashed, right-diagonal green lines are
used to represent various mixing ratio values (fig. 4-29).
These values are printed in green between the 1,000-
hPa and 950-hPa isobars.
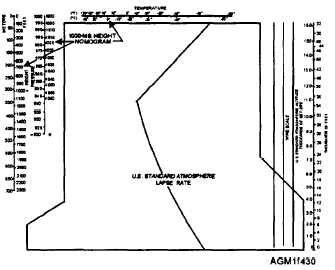
U.S. Standard Atmosphere
The U.S. standard atmosphere is a representation of
the annual average temperatures at various levels in the
atmosphere for the continental United States. It is
shown on the diagram as a heavy brown line (fig. 4-30).
The height scale on the right side of the diagram, in both
meters and feet, is calibrated to the U.S. Standard
Atmosphere. The heights provided on the left side of
the diagram under the pressure level labels are based on
the U.S. Standard Atmosphere. The values in
parenthesis are provided in geopotential feet, while the
values in the square brackets [ ] are given in
geopotential meters.
Wind Plotting Scale
A wind plotting scale is also provided on the right
side of the diagram (fig. 4-30). Three identical wind
scales are provided because up to three successive
soundings may be plotted on the same diagram. This is
Figure 4-28.—Example of the saturation adiabat scale on a
Skew T, Log P diagram.
Figure 4-29.—Example of the saturation mixing ratio scale on
a Skew T, Log P diagram.
a procedure used by forecasters to study the changes in
the atmosphere with time for a single location.
Later, as you progress as an Aerographer’s Mate,
you will learn more about the other scales on the
diagram and their uses.
PRESSURE-ALTITUDE SCALE
A modified procedure to accurately determine
heights of features analyzed on a Skew T diagram was
introduced in 1987. This procedure requires you to
construct a height scale on the diagram before plotting
information. You will use the scale to plot reported
altitudes of mandatory pressure levels. These levels are
then used to construct a pressure-altitude (PA) curve.
Figure 4-30.—Example of the U.S. standard atmosphere and
related height scale, as well as the wind plotting scale.
4-27


