by multiplying the height in half-meters by 3, then
dividing by 2. Converted heights are usually plotted by
writing the sea height over the swell height as in a
fraction immediately to the right of the plotted report.
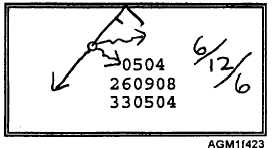
Figure 4-23 shows a computer-plotted report of the sea
and swell waves. The observer has converted the height
in half-meter units to height in feet, and has written the
converted height to the right of the report.
Sometimes the analyst may ask the observer to
draw arrows for the wave directions. When this is
required, the observer draws a "straight" arrow pointing
away from the station circle directly opposite the wind
direction as shown. Since seas are caused by the wind,
the direction the seas are moving toward is opposite the
wind direction (direction winds are blowing "from").
The swell-wave directions report the direction the
swells are coming from.
Swell-wave directions are
indicated by drawing a "wavy" arrow from the station
circle pointing opposite the reported direction. The
primary and secondary swell-wave directions (080° and
150°) are drawn above.
A shorter wavy arrow is
sometimes used to indicate the secondary swell-wave
direction.
Two charts are routinely derived from sea- and
swell-wave reports:
the significant wave height
analysis and the combined sea-height analysis. The
computer systems at FNMOC routinely produce
significant wave height analyses. The combined sea-
height analysis is normally analyzed from computer
plotted observation data. Aboard ship, sea and swell
heights are normally plotted by the TESS system, but
are occasionally manually plotted. The analyst may
analyze both sea and swell wave directions and heights
independently to produce a sea and swell wave analysis,
or analyze just the higher of the sea or swell wave
heights for a significant wave height analysis. In all
types of wave height analyses, isoheight contour lines
are drawn at 3-foot intervals, normally as solid black
lines. Arrows may be added by the analyst to indicate
prevailing wave directions.
Figure 4-23.—Computer-plotted wave report with observer-
entered beight conversions and direction arrows.
The Combined sea-height, often identified as the
"C-height," is defined as the square root of the sea-wave
height squared plus the swell-wave height squared. The
combined sea-height represents an approximation of
the height of the highest crests of water formed when the
crests of sea waves interact with the crests of swell
waves. For example, a reported sea height of 3 feet with
a reported swell height of 4 feet would result in a C-
height equal to the square root of 32 plus 42, or 5 feet. If
the C-height is not computer-calculated and plotted, the
analyst or the observer calculates the values and plots
them to the right of each observation plot. This is
normally done by using a table that is produced locally.
Q36.
Q37.
Q38.
Q39.
Q40.
Q41.
Q42.
REVIEW QUESTIONS
Where are remarks plotted on a METAR code
plotting model?
What does the symbol [64] indicate?
What does the symbol [13] indicate?
What does the symbol [22] indicate?
What is the normal contour interval for an SST
analysis?
How is 4-day old SST information annotated on
an SST analysis?
How are sea and swell wave directions depicted
on a sea height chart?
SKEW T, LOG P DIAGRAM
LEARNING OBJECTIVES: Identify the scales
used to plot reported information on the Skew
T, Log P diagram. Discuss how the Pressure
Altitude scale is constructed. Describe how
reported information is plotted on the diagram
and how the temperature, dew-point
temperature, and pressure altitude curves are
completed by using plotted information.
One of the most useful products for analysis of the
state of the atmosphere over a single location is the
Skew T, Log P diagram. The standard Skew T, Log P
diagram is one of the few products that provides a
complete profile of the atmosphere in the vertical, from
the surface to as high as 25 hectopascals.
4-24


