TCU, the designation is plotted to the right of the layer
height. Total cloud layer coverage is plotted as the
symbols 0 for clear (no cloud layers reported), 0 for
few or scattered,
for broken,
for overcast, or
for obscured. The sea level pressure in hectopascals
is plotted in the upper right of the station circle.
Visibility is plotted in statute miles. Weather may
be either plotted in the letter code as reported or
converted to standard symbology at the forecaster’s
discretion (see Appendix IV). If an overseas location
reports CAVOK instead of visibility and cloud layers,
plot 9999 for visibility and OK to the right of the station
circle. Runway visual range and remarks are plotted
below and to the right of the station circle.
SEA-SURFACE TEMPERATURE CHART
The sea-surface temperature (SST) chart may be
manually plotted or computer-plotted. Reports of
satellite-sensed sea-surface temperature or synoptic-
observation sea-surface temperatures are used. If
plotted by a computer, the chart is routinely
supplemented with any and all data available from other
sources. An SST chart that uses various sources of
information is called a "composite" SST chart. If based
on satellite observations, the chart is supplemented with
ship synoptic SST reports as well as ship and aircraft
bathythermograph observation SSTs. Normally, up to 3
days of collected data is used for a manually plotted SST
chart. Only in the most data-sparse areas is it
considered acceptable to use reportsup to 10 days old.
The analyst normally draws isotherm contours on
the plotted chart at 2-degree Celsius intervals for an SST
analysis.
Since both new and older data are used and several
types of data are combined, each type and age of data
must be identified to allow the analyst to weight each
report for accuracy.
Data are routinely coded with
symbols to indicate both the source and the age of the
report. Recent calibrated infrared satellite observations
of the sea surface in cloud-free and low-humidity areas
are considered the most accurate and reliable. Recent
bathythermograph observations are next in accuracy,
while recent ship-observed SST reports are least
reliable. Satellite observations are usually computer-
plotted on the base chart, with the temperature (in
degrees Celsius) plotted next to a small square. When
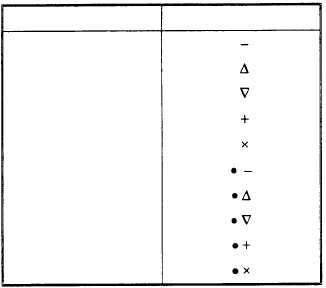
supplemented with ship SST observations, the ship-
reported SST is plotted following a Day Code symbol,
as shown in figure 4-22. For example, ship-reported
SSTs from the current day may be plotted as -12.3
DAYS OLD
SYMBOL
Current Day
1 day old
2 days old
3 days old
4 days old
5 days old
6 days old
7 days old
8 days old
9 days old
Figure 4-22.—SST data age plotting symbols.
(12.3°C) or --0.3 (-0.3°C), while a report of an -0.5°C
ship-reported SST 3 days old is plotted as +-0.5.
Aircraft or ship bathythermograph SST reports are also
plotted by following the date codes shown in the table,
but the bathythermograph observations are always
circled. For example,
D
14.6
indicates
a
bathythermograph reported 14.6°C SST 1 day old.
If the validity of an SST report is in question, the
report is underlined, such as
17.7 . If a report is
corrected before plotting, the report is double-
underlined, such as x22.2.
Enter the symbols and age of the data in a legend
block in the top or bottom margin of the chart.
As with the SST chart, there are a few special
practices followed with the sea height chart.
SEA HEIGHT CHART
The sea height chart is usually a computer plot of
ship and coastal station locations for a given synoptic
time, showing only the wind speed and direction, the
sea-wave height group (PwPwHwHw from the
2PwPwHwHw group), the primary swell-wave direc-
tion/period/height group (dw1dw1Pw1Pw1Hw1Hw1),
and the secondary swell-wave direction/period/height
group (dw2dw2Pw2Pw2Hw2Hw2). The computer plotted
chart may also have a preliminary pressure analysis
printed to aid the analyst. Ship reports received late and
classified ship reports may require manual plotting on
the chart following the format of the computer plot.
Unless the computer is instructed to convert
reported heights in half-meter units to feet, the observer
must convert the heights. Heights are converted to feet
4-23


