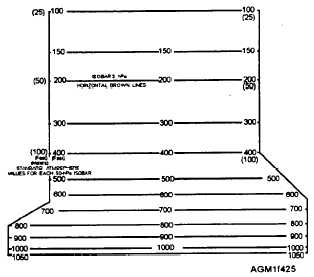
hPa at the bottom of the chart to 100 hPa at the top (fig.
4-25). Pressure values are printed in the center of the
diagram as well as at both the left and right sides. The
upper portion of the isobar scale from 400 to 100
hectopascals is also used to plot pressure levels 100 to
25 hectopascals. Most of the mandatory reporting
levels are indicated by slightly thicker brown lines.
When the station pressure is lower than 1000 hPa, the
height of the 1000 hPa surface may be obtained from the
nomogram in the upper lefthand comer of the diagram.
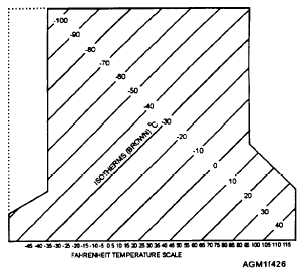
Isotherm Scale
Isotherms are lines of equal temperature. The scale
is depicted as a series of straight, solid brown, right-
diagonal lines (fig. 4-26). Isotherms are evenly spaced
at l-degree Celsius intervals ranging from warm
temperatures (around 50°C) at the lower right to cold
temperatures (near minus 120°C) at the upper left. The
temperature range varies on the different versions of the
chart. Isotherms are labeled every 5 degrees, and a
Fahrenheit temperature conversion scale is printed
across the bottom edge of the isotherm scale.
Dry Adiabat Scale
Saturation Adiabat Scale
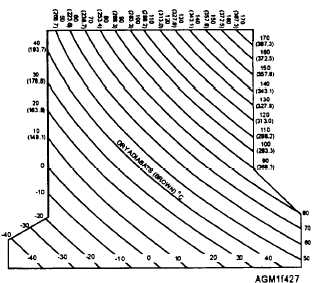
The dry-adiabatic lapse rate is the rate at which
nonsaturated air cools when it rises in the atmosphere,
or warms when it subsides.’ On the scale, dry adiabats
are slightly curved, solid brown, left-diagonal lines at a
2°C interval (fig. 4-27). Values for the dry adiabats are
the same as the intersecting isotherm at the 1,000-hPa
Figure 4-25.—Example of isobars on a Skew T, Log P
diagram.
Figure 4-26.—Example of isotherms on a Skew T, Log P
diagram.
level, and are printed across the top edge and right side
of the diagram.
The saturation-adiabatic lapse rate (sometimes
called a moist-adiabatic lapse rate), is the rate at which
saturated air cools when it rises, or warms when it
subsides. On the scale, saturation adiabats are solid,
Figure 4-27.—Example of the dry adiabat scale on a Skew T, Log
P diagram.
4-26


