standard plotting model for upper-air observed data. As
an example, we have used a ship observation. A land
station report is plotted in the same manner, using the
block-station number to locate the station. Block-
station number is not plotted.
Notice in the constant pressure level plotting model
that the tens digit of the wind direction is normally
plotted near the base of the wind barb. A plus sign (+)
after the tens of wind direction is used by WMO
guidelines to indicate wind directions reported at odd
five-degree increments. The hour of the observation
GG is plotted in parenthesis to the right of the report
only when the report is more then 1 hour off the synoptic
chart time. The station circle is filled in when the dew-
point depression is less than or equal to 5°C.
REVIEW QUESTIONS
Q28. Besides speed and accuracy, what else is a
significant advantage of the TESS computer
plotting system?
Q29. What does an 5" on the center of the shafi of a
wind plot indicate?
Q30. Where is air temperature information placed on
a surface observation plotting model?
Q31. Where is pressure change information placed on
a plotting model?
Q32. Where would the observation time be plotted if a
particular observation was from a different
synoptic period than the overall chart?
Q33.
How is total shy cover information indicated on a
METAR surface observation plotting model?
Q34.
How is ship movement plotted on a ship synoptic
model?
Q35. What does a filled in station circle indicate on a
constant pressure standard plot?
METAR Plotting Models
The synoptic surface and synoptic constant
pressure level plotting models are used every 6 hours to
plot data for the synoptic hours. In the United States, the
NWS also provides Synoptic Intermediate Surface
Analysis charts, so surface analyses are available every
3 hours. Occasionally, a forecaster may need hourly
plots of data for small areas. This is usually done to
allow the analyst to preform a Local Area Weather
Chart (LAWC) analysis. LAWCs are used to track
weather features whenever a detailed picture of
developing weather conditions is required for a small
area, usually only a few states in size. LAWCs are
usually not done for ocean areas due to the lack of
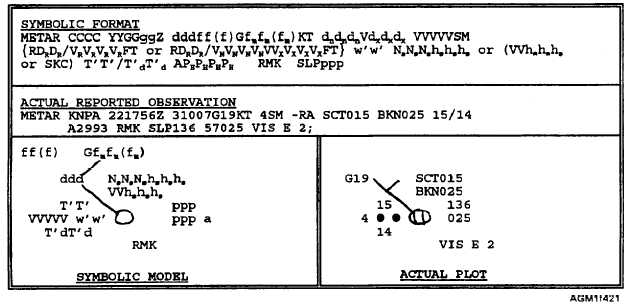
observations. Figure 4-21 shows the METAR plotting
model.
In METAR code plotting, the weather is either
plotted in the letter abbreviations as reported, or
converted to standard symbology at the forecaster’s
discretion. See Appendix IV for the standard weather
symbology. The first reported cloud layer is plotted
above the station circle with each successive layer
plotted below the first. If a layer is identified as CB or
Figure 4-21.—METAR code plottiog model.
4-22


