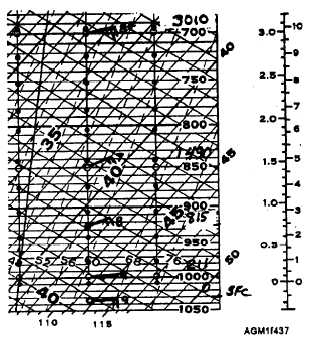
center and/or left wind scales. The right-most wind
scale is used to transfer wind history from a previously
plotted diagram. The wind shaft is drawn extending
from the small, nondarkened circle at each mandatory
level isobar in the same manner that a constant-pressure
level wind is plotted. For plotting wind direction, true
north is the top of the chart, and due south, the bottom of
the chart. The shaft extends toward the reported wind
direction, the tens value of the wind direction is written
near the end of the shaft, and the odd five-degree
increments of reported direction are indicated by a
small plus sign (+) after the tens value of the direction.
Wind speed is indicated on the wind shaft in the
same manner as surface and constant-pressure level
plots (fig. 4-37).
The data for the mandatory pressure levels above
100 hectopascals is obtained from message Part C, and
plotted in the same manner. Levels of missing data are
noted on the diagram just above the last available
reported data.
Figure 4-37.—Wind direction and speed plotted at each
mandatory pressure level.
After the mandatory level data is plotted, the
pressure altitude curve may be drawn. This is discussed
following this section on plotting data, but must be
accomplished before fixed regional level winds are
plotted.
Plotting Significant Levels
All significant level data is normally plotted in
addition to the mandatory level data. All stations report
TEMP CODE PART B (NON-REGION IV)—Significant level indicators for both temperature/humidity and
winds are bolded.
TTBB 64120 47580 00030 05050 11930 06040 22770 02920 33650 10100 44600
14740 55435 29769 66358 38170 21212 00030 13015 11990 17022 22985 17035
33972 17015 44925 18005 55860 19015 66700 20025 77550 22040 88320 23050
99300 23070 11260 23112 22220 23090 33100 24060 31313 46105 81135 41414
43322;
SYMBOLIC FORMAT—
MiMiMjMj YYGGa4 IIiii
(identification)
nnnnPnPnPn TnTnTanDnDn ..... .....
(significant temperature and humidity levels)
21212 nnnnPnPnPn dndnfnfnfn ..... .....
(significant wind levels - not included in Region IV)
31313 srrarasasa 8GGgg (9SsTWTWTW)
(sounding system and tracking method, observation time and
SST)
41414 NhCLhCMCH;
(cloud data)
Figure 4-38.—Significant temperature/humidity and wind levels as reported in TEMP code.
4-32


