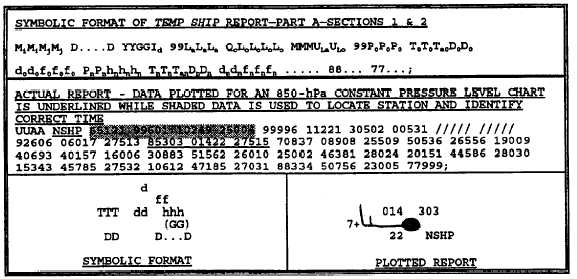
Figure 4-19.—Synoptic ship observation plotting models.
Synoptic Upper-air Plotting Model
pertaining to each standard level may be plotted on the
A complete upper-air observation report may be
appropriate constant pressure level chart. For an 850-
plotted on a single chart—the Skew T, Log P diagram,
hPa pressure level chart, only the data reported for the
850-hPa level is extracted from each individual
discussed later in this chapter—or sections of the report
observation for plotting. Figure 4-20 shows the
Figure 4-20.—Standard plotting model for constant-pressure level data received in upper-air observation reports.
4-21

