Synoptic Surface Plotting Models
The plotting models for both land stations and ship-
reported synoptic surface and upper-air observations
are dictated by World Meteorological Organization
publication WMO No. 305, Guide on the Global Data-
processing System, Volume II, Preparation of Synoptic
Weather Charts and Diagrams. Plotted observations
use symbols, numbers, and letters to depict various
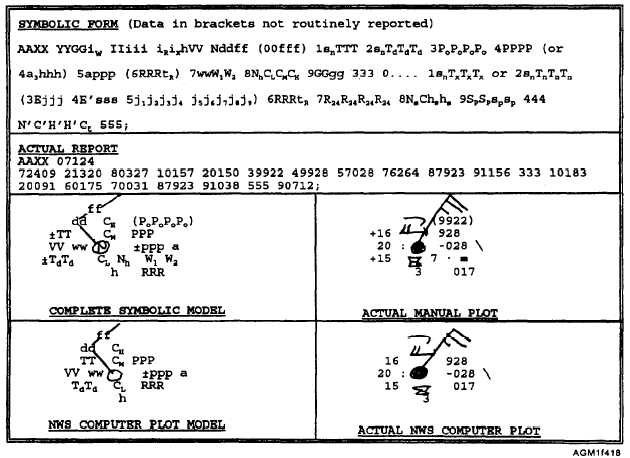
reported data. Figure 4-18 shows the symbolic Land
Synoptic code, the symbolic plotting model, an actual
report, and the plotted report. Figure 4-19 shows the
symbolic Ship Synoptic code, the symbolic plotting
model, an actual report, and the plotted report.
Normally, only observations from the same
synoptic hour are plotted on a chart. If observations
from a past synoptic hour say, 0300Z or 0000Z data
plotted on a 0600Z chart, the observation hour is plotted
below the station model, such as 032 or 00Z. Late
reports and off-time reports may be manually plotted on
a computer plotted chart to aid reanalysis in data sparse
areas. When this is done, late reports corresponding to
the synoptic hour of the chart are normally hand plotted
are plotted in different colored ink, such as blue, red, or
green. (Note: red ink or pencil does not show up on a
chart under shipboard red lighting and normally does
not copy well on a photocopier.)
Quadrant-of-the-globe, latitude, and longitude, or
the block and station number in the case of land
observations, are not plotted, but are used to locate the
station circle.
Several reported values are plotted with a graphic
symbol vice the reported numeric value. Total sky
cover, N, is indicated by shading portions of the station
circle. Present weather, past weather, cloud types,
pressure tendency, and the ships course-made-good are
also indicated by symbols. These are shown in
Appendix IV.
Reported temperatures are rounded off to the
nearest whole degree Celsius for land station reports.
For ship reports, temperatures are not rounded off, but
plotted as they are reported to the nearest tenth degree
Celsius. Only the sea-surface temperature contains a
decimal point before the tenths value by WMO
in black ink, while older synoptic intermediate reports
guidelines.
Figure 4-18.—Synoptic land observation plotting models.
4-20


