Rawinsondes, which penetrate cloud systems,
reflect, to some extent (primarly in the humidity trace),
the vertical distribution of clouds. If the humidity
element were perfect, there would usually be no
difficulties in locating cloud layers penetrated by the
instrument.
Because of the shortcomings in the
instrument, however, the relationship between indicated
humidity and cloud presence is far from definite, and art
empirical interpretation is necessary. Nevertheless,
rawinsonde reports give valuable evidence that, when
compared with other data, aids greatly in determining a
coherent picture of stratiform and frontal cloud
distributions. Their value in judging air mass cumulus
and cumulonimbus distribution is negligible.
INFERRING CLOUDS FROM RAOB
Theoretically, we should be able to infer from the
humidity data of RAOBs the layers where the
rawinsonde penetrates cloud layers. In practice, the
determination that can be made from temperature and
dewpoint curves are often less exact and less reliable
than desired. Nevertheless, RAOBs give clues about
cloud distribution and potential areas of cloud
formation. These clues generally cannot be obtained
from any other source.
DEWPOINT AND FROST POINT IN
CLOUDS
The temperature minus the dewpoint depression
yields the dewpoint, which is defined as the temperature
to which the air must be cooled at a constant vapor
pressure for saturation to occur. The FROST POINT
(that is, the temperature to which the air has to be cooled
or heated adiabatically to reach saturation with respect
to ice) is higher than the dewpoint except at 0°C, where
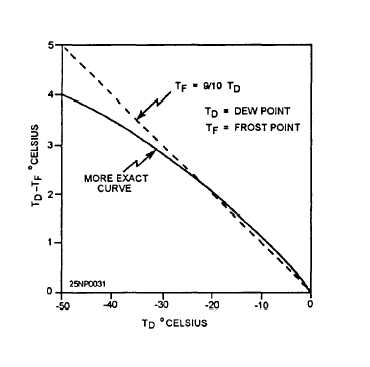
the two coincide. In the graph shown in figure 4-15, the
difference between dewpoint and frost point is plotted
as a function of the dewpoint itself.
In a cloud with the temperature above freezing, the
true dewpoint will coincide closely with the true air
temperature, indicating that the air between the cloud
droplets is practically saturated. Minor discrepancies
may occur when the cloud is not in a state of equilibrium
(when the cloud is dissolving or forming rapidly, or
when precipitation is falling through the cloud with
raindrops of slightly different temperature than the air);
but these discrepancies are very small. In the
subfreezing portion of a cloud, the true temperature is
between the true dewpoint and the true frost point,
depending on the ratio between the quantities of frozen
Figure 4-15.-Difference between frost point and dewpoint as
a function of the dewpoint.
and liquid cloud particles. If the cloud consists entirely
of supercooled water droplets, the true temperature and
the true dewpoint will, more or less, coincide. If the
cloud consists entirely of ice, the temperature should
coincide with the frost point. Therefore, we cannot look
for the coincidence of dewpoint and temperatures as a
criterion for clouds at subfreezing temperatures. At
temperatures below -12°C, the temperature is more
likely to coincide with the frost point than the dewpoint.
The graph shown in figure 4-15 indicates that the
difference between the dewpoint and frost point
increases roughly 1°C for every 10°C that the dewpoint
is below freezing. For example, when the dewpoint is
–10°C, the frost point equals –9°C; when the dewpoint
is –20°C, the frost point is –18°C; and when the
dewpoint is –30°C, the frost point is –27°C. Thus, for
a cirrus cloud that is in equilibrium (saturated with
respect to ice) at a (frost point) temperature of –40°C,
the correct dewpoint would be –44°C, (to the nearest
whole degree).
We can state, in general, that air in a cloud at
temperatures below about –12°C is saturated with
respect to ice, and that as the temperature of the cloud
decreases (with height), the true frost point/dewpoint
difference increases. Any attempt to determine the
height of cloud layers from humidity data of a RAOB
is, there fore, subject to error. It is possible to overcome
4-14


