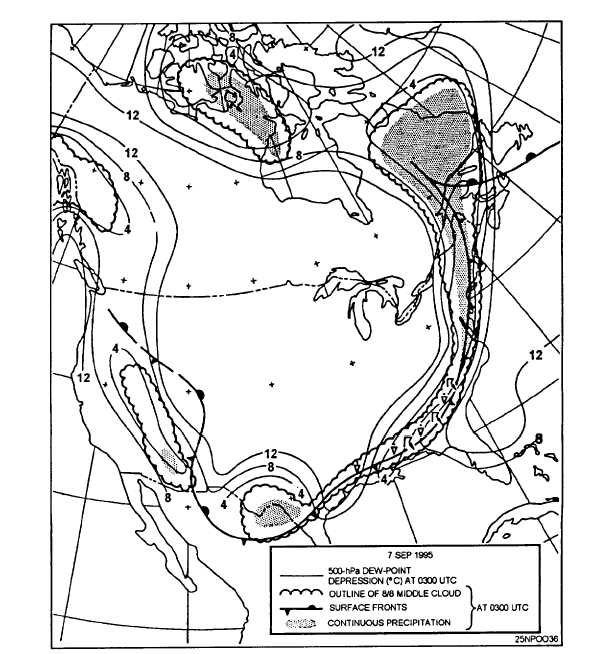
Figure 4-20.-Surface fronts, areas of continuous precipitation, areas covered by 8/8 middle clouds, and isolines of 500-hPa
dewpoint depression at 0300 UTC, 7 September 1995.
precipitation, and also of the larger areas of overcast
compared and, by cross-checking, each can be
middle clouds.
completed with greater accuracy than if they were done
Since the 500-hPa level dewpoint depression
independently.
analysis agrees well with the surface analysis of middle
cloud and precipitation, the possibility exists of
THREE-DIMENSIONAL HUMIDITY
ANALYSIS—THE MOIST LAYER
replacing or supplementing one of these analyses with
the other.
Using a single level (for example, the 500-hPa level
The characteristics of the 500-hPa level dewpoint
dewpoint depression analysis) to find probable cloud
depression analysis, outlined above, make it a valuable
areas does not indicate clouds above or below that level.
adjunct to the surface analysis. These analyses can be
For example, if the top of a cloud system reached only
4-18


