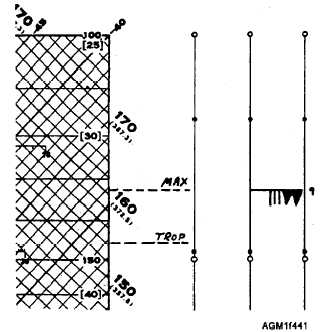
Figure 4-41.—Plotted tropopause and maximum wind
information.
freezing levels. The 10190 group reports extrapolated
altitude of the next higher standard pressure level after
sounding termination. The altitude may be entered and
plotted on the diagram, and EXTRAP should be written
after the altitude to indicate it is extrapolated data. Sea-
surface temperature, as reported following the 31313
group, may be plotted directly under the temperature
trace in the bottom margin of the diagram. An SST of
15.7°C would be plotted as SST = 15.7°C.
TEMPERATURE TRACE
The temperature trace is constructed by connecting
each of the plotted mandatory- and significant-level
temperature plots with a thin solid line. Use a straight-
edge as a guide to draw the lines between each plotted
temperature, in order, from the bottom of the diagram to
the top. Label the temperature trace with a block letter T
at both the top and the bottom.
DEW-POINT TRACE
The plotted position of the reported dew-point
depressions represents dew-point temperature. The
dew-point temperature trace is constructed by
connecting each of the mandatory- and significant level
dew-point plots with a thin dashed line, in order, from
the bottom of the diagram to the top. The trace is labeled
with the letters Td at both the top and bottom.
PRESSURE-ALTITUDE (PA)
CURVE
The pressure-altitude (PA) curve is constructed by
connecting each of the plotted height points with a
continuous solid line. When levels above the 100-hPa
level are plotted on the diagram, a separate continuation
PA curve is constructed connecting the consecutive
altitude plots for the levels above 100 hPa. Each of the
pressure altitude curves should be nearly a straight line,
curving slightly upwards. A sharp bend in the curve at a
particular height usually indicates either a misplotted
height or a reporting error. The PA curve is labeled at
both the top and bottom with the block letters PA.
As a Navy or Marine Corps observer, you will
continue working on your requirements for
advancement, and begin to analyze features on the
Skew T, Log P diagram. Whether you are analyzing a
manually plotted Skew T diagram or using computer
assistance to analyze a Skew T displayed on a video
terminal, a through understanding of the plotting
methods presented in this section is essential.
Information on analysis techniques on the Skew T, Log
P diagram is presented in NAVAIR50-1P-5, The Use of
the Skew T, Log P Diagram in Analysis and
Forecasting.
Q43.
Q44.
Q45.
Q46.
Q47.
Q48.
Q49.
Q50.
REVIEW QUESTIONS
What do the slightly curved, solid brown, left-
diagonal lines on the Skew T diagram indicate?
What do the saturation mixing ratio lines
indicate on a Skew T diagram?
How are heights of features accurately
determined from a Skew T diagram?
What would be the height of a 1000-hPa level
reported in Part A as 00526?
When pressure heights are being plotted on a
Skew T diagram, each printed isotherm is equal
to how many meters?
What symbol is used to indicate dew-point
depression on the Skew T diagram?
What part(s) of an upper air TEMP coded report
contain signifcant level data?
In what manner is the level of maximum wind
annotated on a Skew T diagram?
4-35


