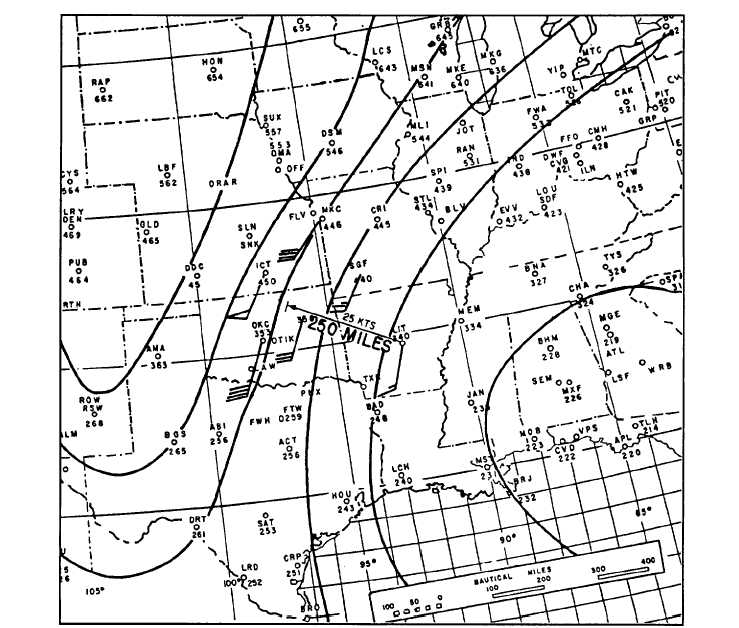
25NP0047
Figure 5-6.-Example of anticyclonic shear and curvature at 850 hPa preventing thunderstorms, with otherwise favorable air mass
conditions present in the Little Rock area.
There are a number of methods that maybe used for
50- IP-5, Use of the Skew T, Log P Diagram in Analysis
determining stability or instability. Among these
and Forecasting.
methods are the Showalter Stability Index (SSI), the
Lifted Index (LI), the Fawbush-Miller Stability Index
For more information on the SSI, the forecasting of
(FMI), and the Martin Index (MI). Only the SSI method
peak wind gusts, and the forecasting of hail, refer to the
will be discussed in this TRAMAN.
AG2 TRAMAN, volume 2, unit 6. These subjects are
covered in an abbreviated form in this chapter.
The National Weather Service currently uses the
(LI) method for producing their facsimile products. All
The SSI is the most widely used of the various types
current methods are discussed in detail in NAVAIR
of indexes.
5-9

