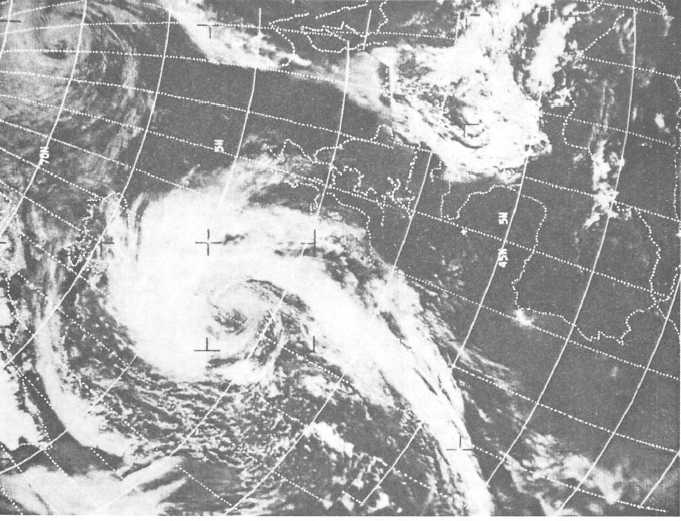
Figure 3-12.-Visual, loud noon, second day.
center at H shows the cold temperatures of
cumulus congestus and cumulonimbus cloud tops.
The same vorticity center is apparent in the
previous (daylight) picture (fig. 3-14) west of the
frontal blind.
SATELLITE IMAGERY PRINCIPLES
The forecaster may use the following general
conclusions in adapting satellite imagery to
forecasting the change in intensity of surface
cyclones:
The use of nighttime IR data together with
daytime data yields 12-hour continuity with
respect to cyclone development or decay.
A hook-shaped cloud mass composed of cold
temperatures, (high cloud tops) indicates an area
of strong upward vertical motion with attendant
surface pressure falls.
As the dry tongue widens, the cyclone
continues to deepen.
3-16

