shows three cases where a fetch AB has moved to the
position CD on the next map 6 hours later. The problem
is determining what part of the moving fetch area to
consider as the average fetch for the 6-hour period.
In figure 6-5, Case 1, the fetch moves perpendicular
to the wind field. The best approximation is fetch CB.
Therefore, in a forecast involving this type of fetch, use
only the part of the fetch that appears on two consecutive
maps. The remaining fetch does contain waves, but they
are lower than those in the overlap area.
In figure 6-5, Case 2, the fetch moves to leeward (in
the same direction as the wind), Since waves are
moving forward through the fetch area, the area to be
used in this case is fetch CD.
Case 3, figure 6-5, depicts the fetch moving
windward (against the wind). Since the waves move
toward A, the region AC will have higher waves than
the area BD. Experience has shown that in this case AB
is the most accurate choice for a fetch,
Determining Accurate Wind Speed
The most obvious and accurate way to determine
wind speed over a fetch is to average the reported values
from ships. This method has the advantage of not
requiring a connection for gradients or stability. But
often there are only a few ship reports available, and ship
reports are subject to error in observation, encoding, or
transmission.
A second way to determine wind speed is to measure
the geostrophic wind from the isobaric spacing and then
correct it for curvature and stability. At first it would
seem this would be less desirable due to the extra time
necessary for corrections. However, barometric
pressure is probably the most reliable of the parameters
reported by ships, and a reasonably accurate isobaric
analysis can be made from a minimum number of
reports. For these reasons the corrected geostrophic
wind is considered to be the best measure of wind speed
over the fetch, except of course in cases where there is
a dense network of ship reports where wind direction
and speed are in good agreement.
The reason for correction to geostrophic wind is that
the isobars must be straight for a correct measure of the
wind. When the isobars curve, other forces enter into
the computations.
The wind increases or decreases
depending on whether the system is cyclonic or
anticyclonic in nature.
The stability correction is a
measure of turbulence in the layer above the water. Cold
air over warmer water is unstable and highly turbulent,
making the surface wind more nearly equal to the
geostrophic wind. Conversely, warm air over colder
water produces a stable air mass and results in the
surface wind being much smaller than the geostrophic
wind.
Three rules for an approximation of the curvature
correction are as follows:
1. For moderately curved to straight isobars-no
connection is applied.
2. For great anticyclonic curvature-add 10 percent
to the geostrophic wind speed.
3. For great cyclonic curvature-subtract 10 percent
ffom the geostrophic wind speed.
In the majority of cases the curvature correction can
be neglected since isobars over a fetch area are relatively
straight. The gradient wind can always be computed if
more refined computations are desired.
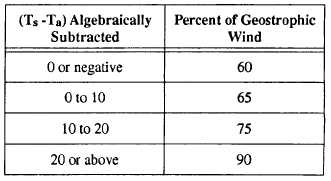
In order to correct for air mass stability, the sea air
temperature difference must be computed. This can be
done from ship reports in or near the fetch area aided by
climatic charts of average monthly sea surface
temperatures when data is too scarce. The correction to
be applied is given in table 6-2. The symbol Ts stands
for the temperature of the sea surface, and Ta for the air
temperature.
Determination of Wind Duration
Once a fetch has been determined and the wind
speed has been found, the next step is to determine the
duration of that wind over the fetch. It is highly unlikely
that the wind will begin and end at one of the 6-hour
map times. Therefore an accurate value must be
interpolated. Inmost cases a simple interpolation of the
successive maps will be sufficient to locate the bounds
of the wind field in space and time.
Table 6-2.-Air-Sea Temperature Difference Correction
6-8


