at adjoining levels. It can also be inferred that the data at
no one particular level is sufficient to locate a front with
certainty in every case. We must consider the horizontal
and vertical distribution of three weather elements
(temperature, wind, and pressure) in a frontal zone.
Temperature
Typical fronts always consist of warm air above
cold air. A radiosonde observation taken through a
frontal surface often indicates a relatively narrow layer
where the normal decrease of temperature with height
is reversed. This temperature inversion is called a
frontal inversion; its position indicates the height of the
frontal surface and the thickness of the frontal zone
over the particular station. The temperature increase
within the inversion layer and the thickness of the layer
can be used as a rough indication of the intensity of a
front. Strong fronts tend to have a distinct inversion;
moderate fronts have isothermal frontal zones; and
weak fronts have a decrease in temperature through the
frontal zone.
Frontal zones are often difficult to locate on a
sounding because air masses become modified after
leaving their source region and because of turbulent
mixing and falling precipitation through the frontal
zone. Normally, however, some indication does exist.
The degree to which a frontal zone appears pronounced
is proportional to the temperature difference between
two air masses.
The primary indication of a frontal zone on a Skew
T diagram is a decrease in the lapse rate somewhere in
the sounding below 400 mb. The decrease in lapse rate
may be a slightly less steep lapse rate for a stratum in a
weak frontal zone to a very sharp inversion in strong
fronts. In addition to a decrease in the lapse rate, there is
usually an increase in moisture (a concurrent dew-point
inversion) at the frontal zone. This is especially true
when the front is strong and abundant cloudiness and
4-27
SOURCE
MP
1024
LOW
HIGH
CT
180
150
120
90
60
30
0
30
60
90
120
150
180
75
60
45
30
15
0
15
30
45
60
75
60
45
30
15
0
15
30
45
60
JULY
MT
1010
MT
MT
1020
1024
1012
MP
LOW
CT
SOURCE
MP
CP
CP
CT
CP
SOURCE
A
C
SOURCE
T
LOW
MP
F
FRONT1018
1010
1010
CT
SOURCE
MT
E
1026
MP
E
MT
1020
HIGH
C T
SOURCE
FR
O.A
MP
1020
HIGH
MT
MP
E
1010
CP
AG5f0426
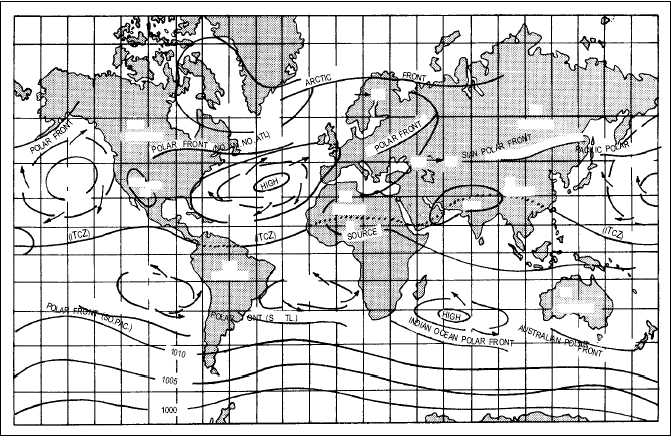
Figure 4-26.—Chart showing world air masses, fronts and centers of major pressure systems in July.


