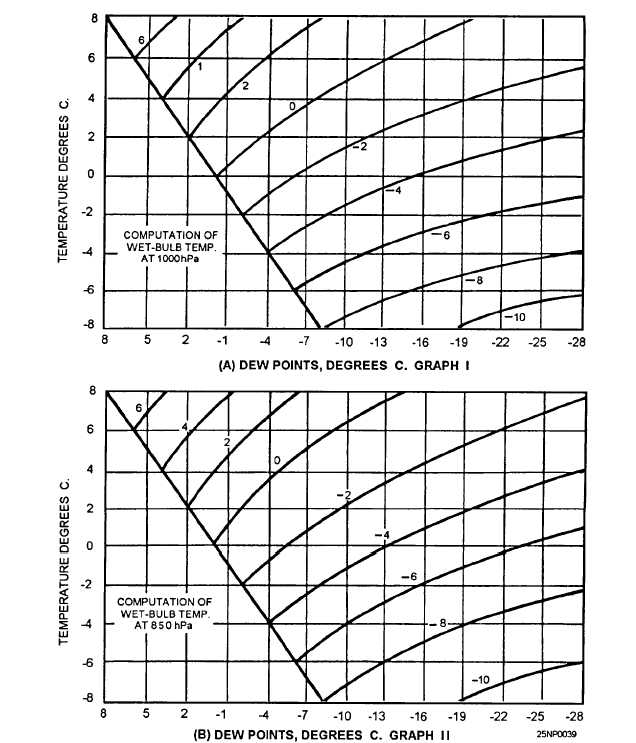
Figure 4-23.-Graphs for computing wet-bulb temperatures. (A) Computation of 1,000-hPa level wet-bulb temperature; (B)
computation of 850-hPa level wet-buib temperature.
minor closed center for one or two maps in the bottom
to 200 miles wide. At any position, the area is parallel
of the trough.
to the warm front and north of the low-pressure center.
Within the maximum area, the rate of snowfall is
The area of maximum snowfaIl lies in the cold air
variable from one case to another, depending upon
to the left of the track and usually describes a narrow
available moisture, amount of vertical shear, etc.
belt oriented east-west or northeast-southwest about 100
However, it is not uncommon for heavy snow (1 inch
4-28

