transferred to the chart, and the single plotted chart is
used for many different applications. This is done
because manually plotting separate charts is very time-
consuming. But when observation data is computer
plotted, such as done by the TESS system, only data
actually needed for a single type of analysis is routinely
displayed. Separate charts may be produced very
quickly for each individual analysis, especially since
the computer performs the initial analysis. For instance,
sea-level pressure, wind speed and direction may be the
only parameters plotted for a simple pressure analysis.
Only the pressure tendency and change group need be
plotted for an isallobaric analysis.
The operator specifies which data to display on the
video screen and how the data is to be displayed. The
standard plotting models presented in this section
should be used as a guide so that the forecaster, when
reviewing a "plotted" chart recalled from a saved data
file, or a hard-copy of the chart, will be able to interpret
the information. These models are also useful in
interpreting plotted data received via facsimile on either
NWS charts in the United States or from foreign
meteorological services.
Wind Plots
Many prognostic charts show plotted wind
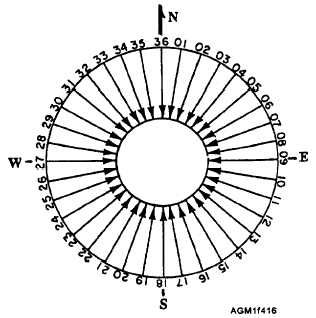
directions and speeds. Winds are always plotted with a
system of winds shafts and barbs. The direction is
Figure 4-16.—Wind direction in true degrees indicated by the
orientation of the wind shaft from the station circle or
station location.
indicated by the orientation of the shaft extending from
the station circle (fig. 4-16). The wind speed is
indicated by the barbs on the shaft and gusts are written
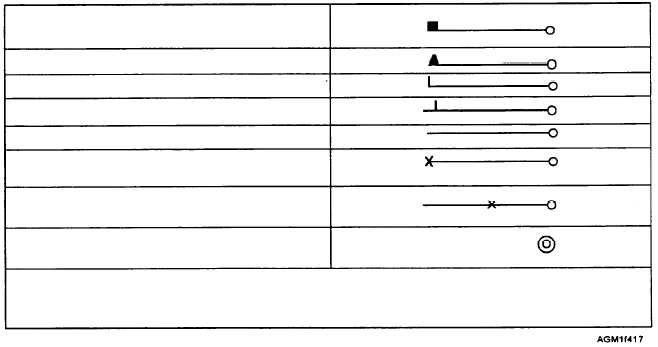
at the end of the wind shaft (fig. 4-17).
TESS 3.0 only . . . A square is used to indicate each
100 knot increment
Flagged barb indicates 50 knot increments of wind
Single barb indicates 10 knot increments
Half barb indicates 5 knots
No barbs on shaft indicates less than 3 knots
An X on the end of the shaft indicates a missing wind
speed
An X on the center of the shaft indicates a missing
wind direction
A circle drawn around the station circle indicates
calm winds
Wind barbs extending clockwise from the wind shaft, as shown above, are used for plots in the Northern
Hemisphere. To plot winds in the Southern Hemisphere, plot wind barbs so that they extend counterclockwise
from the wind shaft.
Figure 4-17.—Wind speed indicated by barbs. Plotted winds are rounded-off to the nearest 5 knots.
4-19