from the National Weather Service. Products produced
by processing data fields received from FNMOC must
have a legend line (or lines) added across the bottom or
top of the graphic identifying the information
displayed. The legend line identifies the product using
standard abbreviations and the valid time. For example,
an analysis of the surface pressure data field of the
1800Z 12 December 1996 observation data may be
identified with a legend line SFC PRESSURE
ANALYSIS VALID 08DEC96 1800Z.
The valid time is the UTC date/time that is
represented by the information on the graphic. On some
products, the valid time is identified with the
designation VT: or the word valid; on other products,
the date and time are just listed. In the case of an
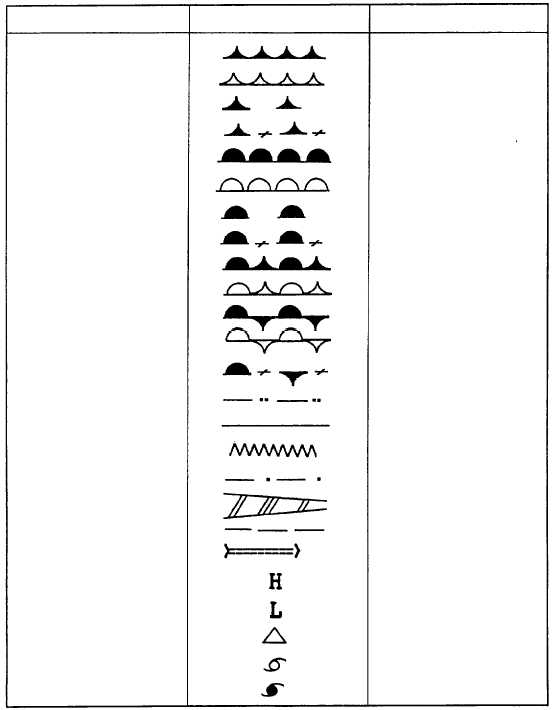
TERM
SYMBOL
COLOR
Cold front at the surface
BLUE
Cold front aloft
BLUE
Cold front frontogenesis
BLUE
Cold front frontolysis
BLUE
Warm front at the surface
RED
Warm front aloft
RED
Warm front frontogenesis
RED
Warm front frontolysis
RED
Occluded front at the surface
PURPLE
Occluded front aloft
PURPLE
Stationary front at the surface
RED AND BLUE
Stationary front aloft
RED AND BLUE
Stationary front frontolysis
RED AND BLUE
Instability / Squall line
PURPLE
Trough axis
BLACK
Ridge axis
BROWN
Shear line
BLUE
Inter-tropical Convergence Zone
RED
Tropical Wave
BLACK
Jetstream core
RED
High Pressure/height center
BLUE
Low pressure/height center
RED
Tropical Depression center
RED
Tropical Storm center
RED
Hurricane / Typhoon center
RED
Figure 4-12.—Symbols used on surface pressure and constant-pressure level analysis and prognosis charts.
4-14