from the Skew T Log P Diagram by using the following
7 steps:
1. Plot the temperature against pressure as
determined from a RAOB sounding.
2. Record the temperature and dewpoint in degrees
and tenths to the left of each plotted point.
3. Determine the difference (in degrees and tenths)
between the temperature and dewpoint for each level.
This difference is D, the dewpoint deficit; it is always
taken to be positive.
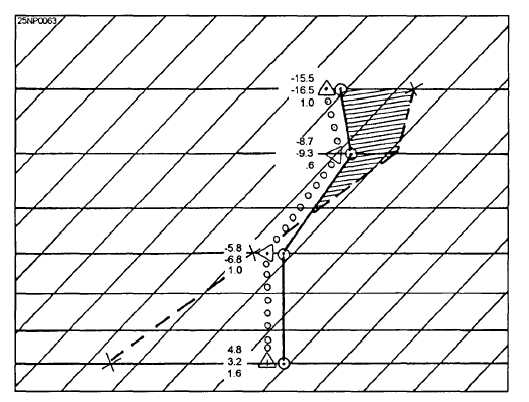
4. Multiply D by –8 and plot the product (which is
in degrees Celsius) opposite the corresponding
temperature point at the appropriate place.
5. Connect the points plotted by step 4 with a
dashed line in the manner illustrated in figure 5-21.
6. The icing layer is outlined by the area enclosed
by the temperature curve on the left and the –8D curve
on the right. In this outlined area, supersaturation with
respect to ice exists. This is the hatched area, as shown
in figure 5-21.
7. The intensity of icing is indicated by the size of
the area enclosed by the temperature curve and the –8D
curve. In addition, the factors given in the following
section should be considered when formulating the icing
forecast. The cloud type and the precipitation observed
at the RAOB time or the forecast time maybe used to
determine whether icing is rime or glaze.
Conclusions arrived at by using the-SD method for
forecasting icing:
. When the temperature and dewpoint coincide in
the RAOB sounding, the –8D curve must fall along the
0°C isotherm. In a subfreezing layer, the air would be
saturated with respect to water and supersaturated with
respect to ice. Light rime icing would occur in the
altostratus/nimbostratus clouds in such a region, and
moderate rime icing would occur in cumulonimbus
clouds in such a region. Severe clear ice would occur
in the stratocumulus virga, cumulus virga, and stratus.
. When the temperature and dewpoint do not
coincide but the temperature curve lies to the left of the
–8D curve in the subfreezing layer, the layer is
supersaturated with respect to cloud droplets. If the
clouds in this layer are altostratus, altocumulus,
cumulogenitus, or altocumulus virga, only light rime
will be encountered.
If the clouds are cirrus,
cirrocumulus, or cirrostratus, only light hoarfrost will be
sublimated on the aircraft. In cloudless regions, there
Figure 5-21.-The –8D ice forecast method.
5-33