PG = D+ CF
Centrifugal force acts with the pressure gradient
force when the circulation is anticyclonic and against
the pressure gradient force when the circulation is
cyclonic. Therefore, wind velocity is greater in an
anticyclone than in a cyclone of the same isobaric
spacing.
Variations
It has been determined that, given the same density,
pressure gradient, and latitude, the wind is weaker
around a low-pressure cell than a high-pressure cell.
This is also true for gradient and geostrophic winds.
The wind we observe on a synoptic chart is usually
stronger around low cells than high cells because the
pressure gradient is usually stronger around the
low-pressure cell.
Geostrophic and Gradient Wind Scales
The geostrophic wind is stronger than the gradient
wind around a low and is weaker than a gradient wind
around a high. This is why the isobar spacing and
contour spacing, for a curved flow, differs from that
determined by a geostrophic wind scale. If the flow
under consideration is around a high-pressure cell, the
isobars are farther apart than indicated by the
geostrophic wind scale. If the flow is around a
low-pressure cell, the isobars are closer together than
indicated by the geostrophic wind scale.
Geostrophic and gradient wind scales are used to
determine the magnitude of these winds (based on
isobar or contour spacing) and to determine the isobar
or contour spacing (based on observed wind speeds).
There are a number of scales available for measuring
geostrophic and gradient flow of both surface and upper
air charts.
Weather plotting charts used by the Naval
Oceanography Command has geostrophic wind scales
printed on them for both isobaric and contour spacing.
The most common scales in general use can be used for
both surface and upper air charts. The scales are in 4mb
and 60m intervals. An example of a geostrophic wind
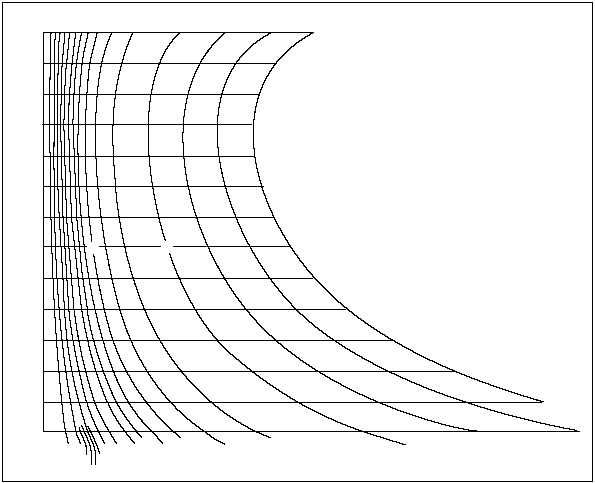
scale is shown in figure 3-13. Note that latitude
3-13
L
A
T
I
T
U
D
E
MAP SCALE = ________
True at lat. ________
ISOBARIC INTERVAL = 4MB
DENSITY AT SEA LEVEL
AG5f0313
VELOCITY (KNOTS
20
25
25
30
35
40
45
50
55
60
65
70
75
80
85
100
100
150
50
50
7.5
7.5
6
6
5
5
10
10
30
30
20
20
15
15
90
70
80
75
40
60
35
O
O
O
O
O
O
O
O
O
O
O
O
O
O
25
10
Figure 3-13.—Geostrophic wind scale.


