4-30.
What value is plotted for sea-surface
temperature?
1.
96
1.
When received
2.
+110
2.
When plotting an LAWC
3.
+11.9
3.
When synoptic reports are considered
4.
+124
inaccurate
4-31.
What is the reported code figure for
low-cloud height?
1.
2
2.
3
3.
6
4.
9
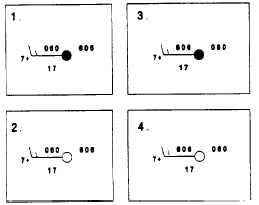
925-hPa LEVEL REPORT
AS CODED: 92606 06017 27513
PPP = 925 HpA
hhh = 606 decameters
TTT = 06.0°C
DD = 1.7°
dd = 275°
Figure 4-D
IN ANSWERING QUESTION 4-32, REFER TO
FIGURE 4-D.
4-32.
Which of the following 925-hPa level plots
is correctly plotted for the information
reported in figure 4-D?
4-33.
4-34.
4-35.
4-36.
When are METAR observations usually
plotted on a chart?
4.
When the forecaster is interested in an
ocean area
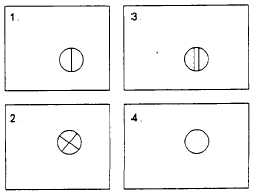
When plotting the total cloud coverage (N)
reported in a METAR observation report,
how should "BKN" be plotted?
Isotherm contours on an SST analysis are
usually drawn at what interval?
1.
Every 2°C
2.
Every 2°F
3.
Every 4°C
4.
Every 4°F
What type of data is considered the most
reliable for sea-surface temperature charts?
1.
All IR satellite data
2.
Only calibrated IR satellite data from
low-moisture, cloud-free areas
3. Bathythermograph observations
4.
Ship reported SST
32


