CHAPTER 4
PLOTTING STANDARDS
INTRODUCTION
In the past, Navy and Marine Corps weather
observers spent a lot of time plotting observations on
charts. With the introduction of computer processing
and widespread use of computer printers and plotters,
manual plotting has just about become obsolete. Many
of the charts you will see are completed analyses
received from the Tactical Environmental Support
System (TESS), and other computer systems. TESS
receives raw data, data fields, and completed analyses
and prognoses via the Navy Oceanographic Data
Distribution Expansion System (NODDES). However,
there are still a few tasks the observer must do to prepare
charts for the analyst/forecaster or for a briefing. In this
chapter, we discuss the types of charts and chart
projections routinely used in meteorology. Then, we
discuss some specific types ofproducts used by analysts
and forecasters, and the tasks routinely done by to
prepare these charts for the forecaster. As we discuss
each type of product, we explain the standard data
plotting model or method used to display observed data.
CHARTS
LEARNING OBJECTIVES: Describe the two
primary coordinate systems used to locate
points on the surface of the earth. Identify the
terms used to define various regions of the
globe. Identify the various chart projections
frequently used for meteorological and
oceanographic applications. Discuss how
station identifiers are used to locate weather
stations and airfields.
A chart is a printed reproduction of a portion of the
earth's surface, which may show water and land areas.
Charts use a coordinate system to locate positions on the
chart. The lines of the coordinate system and the shapes
and sizes of land masses vary in appearance, depending
on the projection and scale of the chart used.
COORDINATE SYSTEMS
Two coordinate systems are used by the military.
At sea, naval and merchant vessels use the geographical
coordinate system. Within the North Atlantic Treaty
Organization (NATO) and the U.S. military, ground
forces use the military grid system. Joint operations
between naval and ground forces require that you be
familiar with both systems of coordinates.
Geographical Coordinates
The geographical coordinate system uses a network
of parallels (of latitude) and meridians (of longitude),
which aid in locating the various features shown. Since
earth is generally a sphere (actually it bulges slightly
near the equator and is slightly flattened near the poles),
the most accurate depiction of earth is a globe—a ball-
shaped chart of earth. Globes are very difficult to print
on flat paper or to accurately depict in a book, so they
are seldom used in meteorology or oceanography.
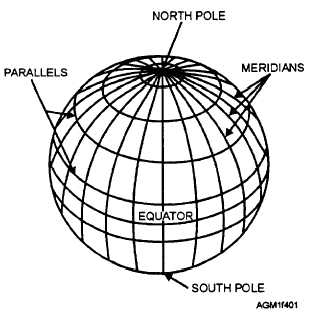
Figure 4-1 is a representation of how parallels and
meridians are arranged on a globe. Notice that the
meridians are farthest apart at the equator and merge at
the poles, and that the parallels circle the earth parallel
to the equator.
Meridians are measured in degrees of arc, with the
prime meridian (0° longitude) established as a line
extending north and south through the location of the
Royal Greenwich Observatory in Sussex, England.
Meridian degrees are referenced as east or west of the
Figure 4-1.—Parallels and meridians on a globe.
4-1


