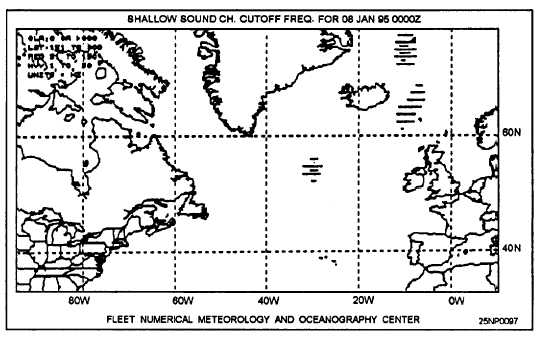


Figure 9-12.-A shaded shallow
sound channel cutoff frequency display.
The first portion of this chapter was devoted to those
oceanographic products that were accessed using
the NODDS.
We will now discuss phenomena and principles
covered in the Fleet
Oceanographic and Acoustic
Reference Manual, RP33. A brief
overview will be
presented for each area discussed. For more
information, see RP33.
FORECASTING EFFECTS OF
AMBIENT NOISE
LEARNING OBJECTIVES Distinguish
ambient noise from self-noise. Identify
characteristics of surface ship traffic and
sea-state noises.
The problem of listening for recognizable sounds in
the ocean is to distinguish them from the total noise
background. Ambient noise is that part of the total
noise background not due to some
identifiable localized source. It
exists in the medium independent of the
observers activity. Interfering noise sources that are
located on, or are a part of, the platform on which a
sensor is installed are sources of self-noise.
AMBIENT NOISE
Deep-sea ambient noise measurements have been
made over a frequency range from 1 Hz to 100 kHz.
Over this range the noise is due to a variety of
sources, each of which may be dominant
in one region of the spectrum.
Principal sources of ambient noise in the
frequency range of about 30 Hz to 10 kHz are distant
shipping and wind-generated surface agitation.
Other important contributors are
rain, ice, and biological activity.
Under certain conditions, these latter sources
of background noise can seriously interfere
with detection systems; however,
not enough is known about their
occurrence to permit meaningful predictions.
Figure 9-13 indicates ambient levels of shipping and
sea noise.
Figure 9-13 may be analyzed as follows:
Along the Gulf Stream and major trans-Atlantic
shipping lanes, the heavy traffic predictor (curve
F) forecasts average noise within 2 dB at
100 and 200 Hz. Maximum values
usually occur with ships closer than
10 nmi and the values follow the
individual ships curve (curve G),
Minimum values vary radically but appear to
group around the average traffic curve (curves D
and E). For
440 Hz, the predictor curves appear to be 2
or 3 dB too low.
9-11

