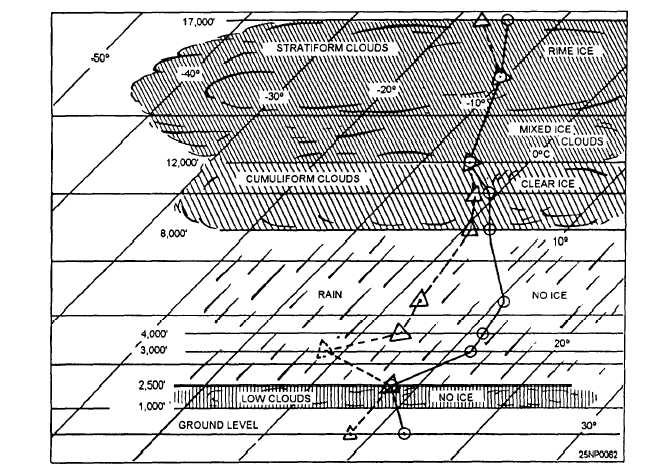
The analysis of cloud type and icing type from the
Skew T Log P Diagram is illustrated in figure 5-20.
First, look at the general shape of the curve. The most
prominent feature is the inversion, which shows a very
stable layer between 2,500 and 3,000 feet. Note that the
dewpoint depression is less than 1 degree at the base of
the inversion. Moisture exists in a visible format this
dewpoint depression, so expect a layer of broken or
overcast clouds whose base will be approximately 2,000
feet and will be topped by the base of the inversion. The
next most prominent feature is the high humidity, as
reflected by the dewpoint depressions, at 8,000 feet.
Since the dewpoint depression is 2°C, a probability of
clouds exists at this level. There is a rapid increase in
the dewpoint depression at 17,000 feet, indicating that
the top of the cloud layer is at this level. You would then
assume the cloud layer existed between 8,000 and
17,000 feet.
The next step is to determine, if possible, the type
of clouds in between these levels. If this sounding were
plotted on the Skew T Log P Diagram, you would be
able to see that the slope of the lapse rate between 8,000
and 12,000 feet is shown to be unstable by comparison
to the nearest moist adiabat. The clouds will then
display unstable cumuliform characteristics. Above
12,000 feet, the lapse rate is shown by the same type of
comparison to be stable, and the clouds there should be
altostratus.
Now determine the freezing level. Note that the
lapse rate crosses the 0°C temperature line at
approximately 9,500 feet. Since you have determined
that clouds exist at this level, the temperatures are
between 0° and –8°C, and the clouds are cumuliform,
forecast clear ice in the unstable cloud up to 12,000 feet.
Above 12,000 feet, the clouds are stratiform, so rime
icing should be forecast.
The intensity of the icing
would have to be determined by the considerations
given in the previous section of this chapter.
Icing Forecasts Using the –8D Method
When surface charts, upper air charts, synoptic and
airway reports, and pilot reports are not clear as to the
presence and possibility of icing, it may be determined
Figure 5-20.-An illustration of the analysis of cloud type and icing type from a Skew T Log P Diagram.
5-32


