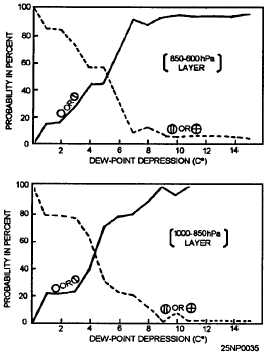
Figure 4-19.-Percent probability of existence of
cloud layer bases for different values of
dewpoint depression (degrees C). Solid lines
represent probability of clear or scattered
conditions; dashed lines, the probability of
broken or overcast conditions with the cloud
layer bases between 1,000-hPa and 600-hPa.
scattered conditions as a function of the dewpoint
depression; the other curve shows that of broken or
overcast conditions. Separate graphs are based on 1,027
observations, which are enough to indicate the order of
magnitude of the dewpoint depressions at the base of
winter cloud layers. Minor irregularities in the curves
were not smoothed out because it is not certain that
they are all due to insufficient data. The graphs are
applicable without reference to the synoptic situation.
For a given winter sounding, you can estimate from the
graph the probability of different sky cover conditions
with cloud bases between 1,000-hPa and 600-hPa for
layers of given minimum dewpoint depressions.
HUMIDITY FIELD IN THE VICINITY OF
FRONTAL SYSTEMS
Studies of the humidity field throughout frontal
zones indicate there is a tongue of dry air extending
downward in the vicinity of the front, and sloping in the
same direction as the front. One study found that such
a dry tongue was more or less well developed for all
frontal zones investigated. This dry tongue was best
developed near warm fronts; it extended, on the
average, down to 700-hPa in cold fronts and to 800-hPa
in warm fronts. In about half the fronts, the driest air
was found within the frontal zone itself on occasion it
was found on both the cold and warm sides of the zone.
About half the flights through this area showed a sharp
transition from moist to dry air, and the change in frost
point on these flights averaged about 20°C in 35 miles.
Some flights gave changes of more than 20°C in 20
miles.
As a frontal cloud deck is approached, the
dewpoint or frost point depression starts diminishing
rapidly. At distances beyond 10 to 15 nm, this variation
is much less. You should keep this fact in mind when
attempting to locate the edge of a cloud deck from
rawinsonde data. Linear extrapolation or interpolation
of dewpoint depressions cannot be expected to yield
good results. For instance, when one station shows a
dewpoint depression of 10°C and the neighboring
station shows saturation, the frontal cloud may be
anywhere between them, except within about 10 nm of
the driest station.
Since the frontal cloud masses at midtropospheric
levels is usually surrounded by relatively dry air, it is
possible to locate the edge of the cloud mass from
humidity data on constant pressure charts. This is so
because the typical change in dewpoint depression in
going from the cloud edge into cloudfree air is
considerably greater than the average error in the
reported dewpoint depression.
500-hPa ANALYSIS OF DEWPOINT
DEPRESSION
Figure 4-20 shows an analysis of the 500-hPa
dewpoint depression field superimposed upon an
analysis of areas of continuous precipitation, and of
areas of overcast middle clouds. The 500-hPa dewpoint
depression isopleths were drawn independently of the
surface data. The analysis shows the following:
1. The regions of high humidity at the 500-hPa
level coincide well with the areas of middle clouds
and the areas of precipitation.
2. The regions of high humidity at the 500-hPa
level are separated from the extensive dry regions
by strong humidity gradients. These gradients are,
in all probability, much stronger than those shown
on this analysis.
3. A dewpoint depression of 4°C or less is
characteristic of the larger areas of continuous
4-17