information, sea-current data, weather observations,
search asset data, and search plan information.
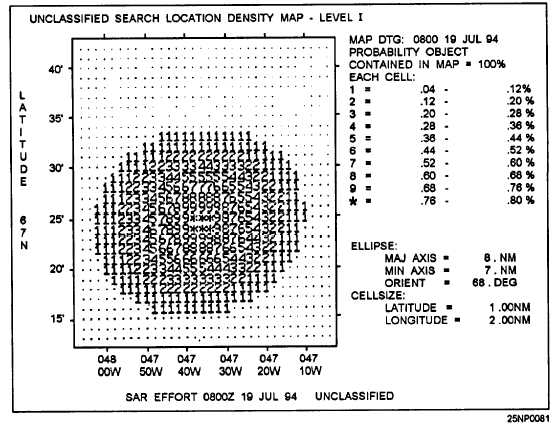
Figure 8-2 shows an example output of the search
location density map. The output shows numbered cells
that represent relative probabilities of the search object
being located within the cell.
Table 8-3 shows an example output of a search
recommendation, level I. This is a tabular display
describing a recommended rectangular search area. The
available assets are listed with their on-station duration
and area of coverage. Also shown is the position of the
search and the cumulative detection probability of
previous searches.
RAYTRACE (RAY)
LEARNING OBJECTIVES
Identify
applications, limitations, and assumptions of
the RAY program, Interpret the RAY program
output.
The RAY program may be used to understand how
sound propagates through a specific environment by
tracing and displaying the paths of individual sound
rays. The rays to be traced maybe specified by the user
or selected by the module.
APPLICATION
The RAY program graphically displays the
interaction between the environment and the sound
energy propagating through it. Its function is to display
regions of a water column for a given set of
environmental parameters (that is, sound speed profile
and bottom topography [insonify regions]). Likewise,
it can be used to easily display those regions of the water
column that are not insonified due to shadow zones and
bathymetric blockage. The RAY program serves as a
modifier of flat bottom omnidirectional
propagation-loss
output by depicting the
ranges/bearings from the source location where bottom
effects may impact the propagation-loss curve. For a
skilled interpreter, a finely detailed ray diagram can also
point out possible locations for convergence zones
(CZs) and shadow zones.
LIMITATIONS AND ASSUMPTIONS
The restrictions as well as the principles taken for
granted in using the RAY program areas follows:
Figure 8-2.-Example output of a search location density map.
8-5

