The contours chosen for display represent radar receiver
thresholds against a particular size (radar cross section)
target. COVER diagrams are also used to assess very
high frequency (VHF) or ultra high frequency (UHF)
communications coverage.
The method used to construct the COVER diagram
depends on whether the EM system is surface-based or
airborne.
Both methods employ raytracing, but for
surface-based systems, coherent interference between
direct and sea-reflected paths, sea-surface roughness,
and diffraction effects are considered.
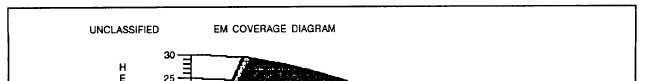
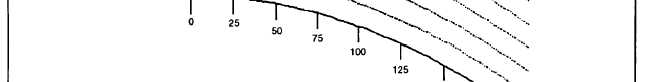
Figure 7-4 shows an example output of a
surface-system COVER diagram. A surface-system
COVER diagram is composed of up to four coverage
lobes. A COVER diagram for an airborne system has
one lobe, drawn by straight lines, emanating from the
antenna height.
A lobe describes the vertical and horizontal limits
of the radar coverage. The shape and size of the lobes
are dependent on the antenna type and the computed or
entered free-space ranges or path-loss thresholds. Each
lobe is where the particular radar device would detect a
certain size target at a specified probability of detecting
that target. Also involved is whether the target is steady
or fluctuating and the probability of receiving a false
alarm on the radar screen.
SHIP ICE ACCRETION
(SHIP ICE)
LEARNING OBJECTIVES: Interpret SHIP
ICE program tabular displays. Identify
limitations and assumptions. Explain how ice
accretion rates are determined by the SHIP ICE
program.
The SHIP ICE program provides estimates of ship
ice accretion rates vs. time given the wind speed and the
air and sea-surface temperatures at various forecast
times. Ice accretion from sea spray upon the ship’s
superstructure can impair the operational capability and
safety of the ship.
APPLICATION
This program can be used to predict the ice accretion
on a ship’s superstructure due to sea spray. It can assist
in planning by considering the icing effects along an
Figure 7-4.-Example output of the EM coverage diagram.
7-12